Monday 7 May 2012

Uploading/calling PDF file into OBIEE 11g using Analysis Part 2

Hi...

In my last post of " Uploading/calling PDF file into OBIEE  11g using Analysis " I had told that I will post if file/PDF does not exist on server then how to overcome for "Server Not Found" error,so here is the solution for that. I will directly start with Part 3 present in my last blog.

Calling PDF file dynamically in Analysis without getting Server Not Found issue. 

If you want to call the PDF file dynamically then there should be one column which will hold the name of the PDF. You can create your separate table in DB which will hold the name of the PDF. Let say in presentation you have one dimension as PDF and it contains two column as PDF Number and PDF Name. suppose my PDF names are 41005.pdf,41006.pdf,41007.pdf and so on....no matter number or char as we can cast it.The steps are :


1.  If data value is in number then cast it to char. to do this hover on column - Click on "Edit Formula" and cast the column from number to char data type.


 2. Now to pass the value of the column to browser, hover you mouse pointer over column - select column properties - click on Data Format - enter the following :

@[html]"<a href=javascript:test1('http://myservername/analyticsRes/"@H".pdf')>"@"</a>" 


Note : I have created small JavaScript and above I am passing parameter in test1 function whcih will hold the data value (PDF/File name) and if it is present then it will open up that particular (PDF/File name) and if it is not present then instead of showing Server Not Found message it will prompt user by showing custom message present in script for e.g "File Does Not Exists" or any user defined message.I will show it in upcoming steps.


 3. Click on save. Save the analysis.
 4. Now go on “Results” tab and select “Static Text” view and put following JavaScript :


<script>
function test1(strURL){
var test = FileExists(strURL);
if(test == true)
window.location=strURL
else
alert("Sorry, the pdf you have requested is not available.");
}
function FileExists(strURL)
{
var req = this.window.ActiveXObject ? new ActiveXObject("Microsoft.XMLHTTP") : new XMLHttpRequest();
req.open("GET", strURL, false);
req.send(null);
if (req.status == 200){
return 1;
}
return 0;
}
</script>


5. Please don't forget to click on "Contains HTML Markup" in “Static Text” view. It will look like:


6. Here you may or may not include  “Static Text” view in Compound Layout. It just want script to be  written and “Static Text” view is the best option.Now save your analysis and check for results.
If file/PDF exists then it will open it and if it does not exists then it will prompt user as below:

Popup window in OBIEE


Popup window in OBIEE 

Hi…
We can open any sites or drill down report from our dashboard page by clicking on data value of report. Here is the original JavaScript for it…

<script language="javascript" type="text/javascript">
<!--
function popitup(url) {
        newwindow=window.open(url,'name','height=200,width=150');
        if (window.focus) {newwindow.focus()}
        return false;
}

// -->
</script>

Then, you link to it by:
<a href="popupex.html" onclick="return popitup('popupex.html')"
        >Link to popup</a>
 

Ø  Now let’s implement it in our OBIEE…

·         Calling any site (URL) from web by clicking on data value of report using JavaScript.
1.       Create report of your choice.

2.       Now click on Column Properties>Data format.

3.       Check “Override Default Data Format “and select “Custom Text Format”.

4.       Put following formula in “Custom Text Format” and click on OK:

@[html] "<a href="javascript:popitup('http://shahin-obiee.blogspot.in/2012/01/uploadingcalling-pdf-file-into-obiee.html')">"@"</a>"<html>


Note: You can put any link in popitup () function shown above. For e.g. if you want to call L2 (drill down) report in new popup window then you will have to put following formula in Custom Text Format.

@[html] "<a href="javascript:popitup('http://IP address of server/analytics/saw.dll?PortalGo&Action=prompt&path=report name if has space then separated using %2F for e.g. %2Freport%2Fname')">"@"</a>"

5.       Now go on “Results” tab and select “Static Text” view.


6.       Put following JavaScript in “Static Text” view.

<html><script language="javascript" type="text/javascript">
<!--
function popitup(url) {
   newwindow=window.open(url,'name','height=800,width=800');
   if (window.focus) {newwindow.focus()}
}
// -->
</script>
<a href="popupex.html" onclick="return popitup('popupex.html')"></a>
</html>

7.       It will look like :


8.       Now remove the “Static Text” view from “Compound Layout” or you can also keep it in it.

9.       Save the report on dashboard and test it. It will work as :


Take Care.......:)


Tuesday 24 April 2012

Switching Between Multiple Reports In Oracle BI 11g


Dashboard prompts are used for filtering data values in reports, but here is one more functionality of dashboard prompt that is, you can also use it to switch between multiple reports. I will show switching between reports without using any intermediate report. So I am using 3 reports which I want to switch using dashboard prompt which are Analysis A, Analysis B, and Analysis C. Here is an example along with the steps:


Ø  Step I: Create a Dashboard Prompt with the intended reports as a data value (Analysis A, Analysis B, and Analysis C) to be selected. 


1. Click on New->Dashboard Prompt->select any subject area.

Note: It will not affect on our dashboard prompt as we have to create presentation variable of our choice.

2. Definition Pane for dashboard prompt will open. Now select “Variable Prompt” as below.


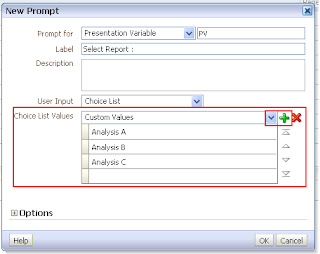
3. Now “New Prompt” dialogue will open. Create presentation variable as PV,label it as Select Report  and select User Input as Choice List.


4. In Choice list Values click on plus (Green Icon) sign; it will display “Enter New Value” dialogue. Now manually enter the names of the reports which you want to display in prompt. Here I will put my three report names which I want to display as a list in dashboard prompt which are Analysis A, Analysis B, and Analysis C as below :


5. Now expand the Options. In “Default Selection” you can give any report name which you want to display by default on dashboard by selecting that report name as “Specific Custom Value”. Here I have given “Analysis A” as my default selection.


6. Now save your dashboard prompt. In this way our dashboard prompt is ready from selecting reports which will look like :


Ø  Step II: Create reports which you want to display according to selected report name in dashboard prompt.

Now I will create three reports named Analysis A, Analysis B, and Analysis C and will apply some filters in theses individual reports which will allow me to show the intended report as per selection made in dashboard prompt. So let’s create “Analysis A” 
 1.  I am taking some columns in reports plus one dummy column. I have change the column formula of Dummy column as:
CASE '@{PV}' WHEN 'Analysis A' THEN '1' ELSE '0' END

 
2. Now I have applied filter on Dummy Column as “is not equal to /is not in” ‘0’.
3. After changing column formula of Dummy Column and applying filter I have hide the dummy column by clicking on Column Properties > Column Format > Checked “Hide” checkbox. We can also delete the Dummy Column but make sure filter on that dummy column is important. Follow the same process in the rest two reports by slightly changing its column formula and filter based on the reports.
 
4. In “Analysis B” I have changed the column formula of Dummy Column and applied filter as :

CASE '@{PV}' WHEN 'Analysis B' THEN '1' ELSE '0' END

5. In “Analysis C” I have changed the column formula of Dummy Column and applied filter as:

CASE '@{PV}' WHEN 'Analysis C' THEN '1' ELSE '0' END


In this way we have done with creating all the three reports with intended filters.


Ø  Step 3: Putting dashboard prompt and three reports in Dashboard by applying certain conditions on each sections in “Edit Dashboard”.

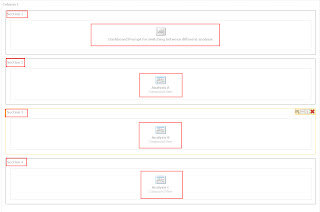
1. In “Edit Dashboard” I am first putting dashboard prompt and then all the three reports as below:


Note: Put all the reports and dashboard prompt in separate sections as we have to apply the condition on section.


2. Now I am applying condition in section of “Analysis A”  by clicking on Properties > Condition > Section Condition as below :


3. For the section of “Analysis B” I am defining condition as: 


4. And finally for the section of “Analysis C” I am defining condition as: 


5. Now save your dashboard page and run it. 


6. Here “Analysis A“is my default report so it is visible on my dashboard by default. Now whatever options (report name) you will select from prompt those report will be shown. It is not necessary to show one default report; you can remove default selection from dashboard prompt. 

7. It will work as :


ENJOY