Dashboard prompts are used for filtering data values in reports, but here is one more functionality of dashboard prompt that is, you can also use it to switch between multiple reports. I will show switching between reports without using any intermediate report. So I am using 3 reports which I want to switch using dashboard prompt which are Analysis A, Analysis B, and Analysis C. Here is an example along with the steps:
Ø Step
I: Create a Dashboard Prompt with the intended reports as a data value (Analysis
A, Analysis B, and Analysis C) to be selected.
1. Click on New->Dashboard Prompt->select any subject area.
Note: It will not affect on our dashboard prompt as we have to create
presentation variable of our choice.
2. Definition Pane for dashboard prompt will open. Now
select “Variable Prompt” as below.
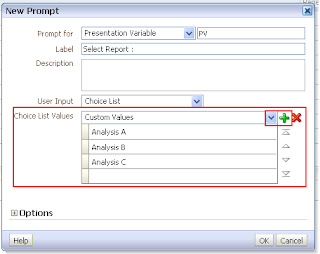
3. Now “New Prompt” dialogue will open. Create
presentation variable as PV,label it as Select Report and select User Input as Choice List.
4. In Choice list Values click on plus (Green Icon) sign;
it will display “Enter New Value” dialogue. Now manually enter the names
of the reports which you want to display in prompt. Here I will put my three
report names which I want to display as a list in dashboard prompt which are Analysis
A, Analysis B, and Analysis C as below :
5. Now expand the Options. In “Default Selection” you
can give any report name which you want to display by default on dashboard by
selecting that report name as “Specific Custom Value”. Here I have given
“Analysis A” as my default selection.
6. Now save your dashboard prompt. In this way our dashboard
prompt is ready from selecting reports which will look like :
Ø Step
II: Create reports which you want to display according to selected report name
in dashboard prompt.
1. I am taking some columns in reports plus one
dummy column. I have change the column formula of Dummy column as:
CASE
'@{PV}' WHEN 'Analysis A' THEN '1' ELSE '0' END
2. Now I have applied filter on Dummy Column as “is not equal to /is not in” ‘0’.
3. After changing
column formula of Dummy Column and applying filter I have hide the dummy column
by clicking on Column Properties > Column Format > Checked “Hide”
checkbox. We can also delete the Dummy Column but make sure filter on that
dummy column is important. Follow the same process in the rest two reports by slightly
changing its column formula and filter based on the reports.
4. In “Analysis B”
I have changed the column formula of Dummy Column and applied filter as :
CASE
'@{PV}' WHEN 'Analysis B' THEN '1' ELSE '0' END
5. In “Analysis C”
I have changed the column formula of Dummy Column and applied filter as:
CASE '@{PV}' WHEN 'Analysis C' THEN '1' ELSE '0' END
In this way we have done with creating
all the three reports with intended filters.
Ø Step 3: Putting dashboard prompt and three reports in
Dashboard by applying certain conditions on each sections in “Edit Dashboard”.
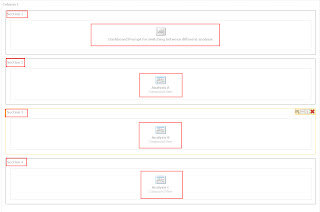
1. In “Edit
Dashboard” I am first putting dashboard prompt and then all the three reports
as below:
Note: Put all the reports and dashboard
prompt in separate sections as we have to apply the condition on section.
2. Now I am applying
condition in section of “Analysis A” by clicking on Properties > Condition >
Section Condition as below :
3. For the section of
“Analysis B” I am defining condition as:
4. And finally for
the section of “Analysis C” I am defining condition as:
5. Now save your dashboard
page and run it.
6. Here “Analysis
A“is my default report so it is visible on my dashboard by default. Now
whatever options (report name) you will select from prompt those report will be
shown. It is not necessary to show one default report; you can remove default
selection from dashboard prompt.
7. It will work as :
ENJOY


Hello and thanks for the useful article.
ReplyDeleteI implemented successfuly the above, but what happens if the user wants to display 2 or 3 out of the 5 reports?
I selected the checkbox "Allow users to select multiple values" but when I select 2 checkbox on the prompt, all the reports disappear.
Any ideas?
Thanks in advance.
Angelina
Thanks this article is very useful. Keep it up Shahin
Delete@Angelina:
You need to change the dummy column condition for multiple selection of reports.
CASE WHEN 'Analysis A' IN (@{PV}) THEN '1' ELSE '0' END
CASE WHEN 'Analysis B' IN (@{PV}) THEN '1' ELSE '0' END
CASE WHEN 'Analysis C' IN (@{PV}) THEN '1' ELSE '0' END
Thanks
Aamir
Hey Thanks Aamir....
DeleteThe condition which you have given will work perfectly.
@Angelina : You can show n number of reports on dashboard by selecting them in dashboard prompt according to your choice. In order to do like this you should have CASE statement present for all of them as told by Aamir...
This works great - thank you so much. My only issue is that the pivot table prompt now only shows one value.
ReplyDeleteVery useful post,
ReplyDeleteIf any one of the report is giving 'NO RESULTS', then How we can place the NO Results report in the dashboard.
do you have answer for your query ?
DeleteVery Usefull Post. thank you
ReplyDeletewonderful information, I had come to know about your blog from my friend nandu , hyderabad,i have read atleast 7 posts of yours by now, and let me tell you, your website gives the best and the most interesting information. This is just the kind of information that i had been looking for, i'm already your rss reader now and i would regularly watch out for the new posts, once again hats off to you! Thanks a ton once again, Regards.
ReplyDeletevery nice information obiee training institutes in hyderebad
ReplyDeleteAll reports are evaluating backend to check for the condition specified. Doesn't this effect the performance?
ReplyDeleteThanks Shahin,
ReplyDeleteWe have tried and successfully implemented the same logic as per customer expectation.
In the Step 3, OBIEE is not letting me write the condition.Please help.
ReplyDeleteNice information. Our institute Is the Leading online institute in Hyderabad, India to provide obiee online trainings with the real time experts and certified professionals. alot OBIEE Online Training.
ReplyDelete>
So awesome blog Thanks for sharing
ReplyDeleteOracle SOA Online Training
Wonderful Tutorial. Thanks a lot. My issue is with the multiple selection. When I select multiple I get a blank page. I did modify the case statement to reflect the above but still getting a blank page. Kindly assist.
ReplyDeleteThanks again in advance
Hi Aamir, It is very useful information, One of the report logic I was doing and applied same logic, worked very nice. Fantastic!! Millions of thanks, Aun Mohammad!!!
ReplyDeleteHi Shahin, Millions of thanks to you , it was very helpful post. Thanks Aun!!
ReplyDeleteDid exactly as told here but in my case what is happening is all the reports are getting loaded on the dashboard and when i select particular analysis from choice list that report is opening in another page. please help me. i dont want all reports to come on dashboard but when i select it should appear in the same dashboard
ReplyDeleteSorry i did mistake in filter condition but now its working fine. Thanks a lot.
ReplyDelete